WebPerf Snippets
A curated collection of JavaScript snippets to measure and debug Web Performance directly in your browser's DevTools console.
What you can measure
| Category | What it includes |
|---|---|
| Core Web Vitals | CLS, INP, LCP, LCP Image Entropy, LCP Sub-Parts, LCP Trail, LCP Video Candidate |
| Loading | TTFB, JS Execution Time Breakdown, FCP, Back/Forward Cache, CSS Media Queries Analysis, Critical CSS Detection, SSR Hydration Data Analysis, Validate Preload on Async/Defer Scripts, Prefetch Resource Validation, Priority Hints Audit, Service Worker Analysis |
| Interaction | Interactions, Input Latency Breakdown, Layout Shift, Long Animation Frames, Long Task, Scroll Performance |
| Resources | Network Bandwidth & Connection Quality |
| Media | Image Element Audit, Video Element Audit |
Quick Start
Copy this snippet and paste it in your browser console to see your page's Core Web Vitals:
// Quick Core Web Vitals Check
new PerformanceObserver((l) => {
  l.getEntries().forEach((e) => {
    const name = e.name || e.entryType;
    console.log(`${name}: ${Math.round(e.startTime || e.value || e.duration)}ms`);
  });
}).observe({ type: "largest-contentful-paint", buffered: true });

new PerformanceObserver((l) => {
  let cls = 0;
  l.getEntries().forEach((e) => {
    if (!e.hadRecentInput) cls += e.value;
  });
  console.log(`CLS: ${cls.toFixed(3)}`);
}).observe({ type: "layout-shift", buffered: true });
For more detailed analysis, explore the snippets in each category.
How to use
Requirements
All snippets are tested in Google Chrome (opens in a new tab). Most snippets also work in other Chromium-based browsers (Edge, Brave, Arc) and Firefox. Safari has limited Performance API support.
Option 1: Run in browser console
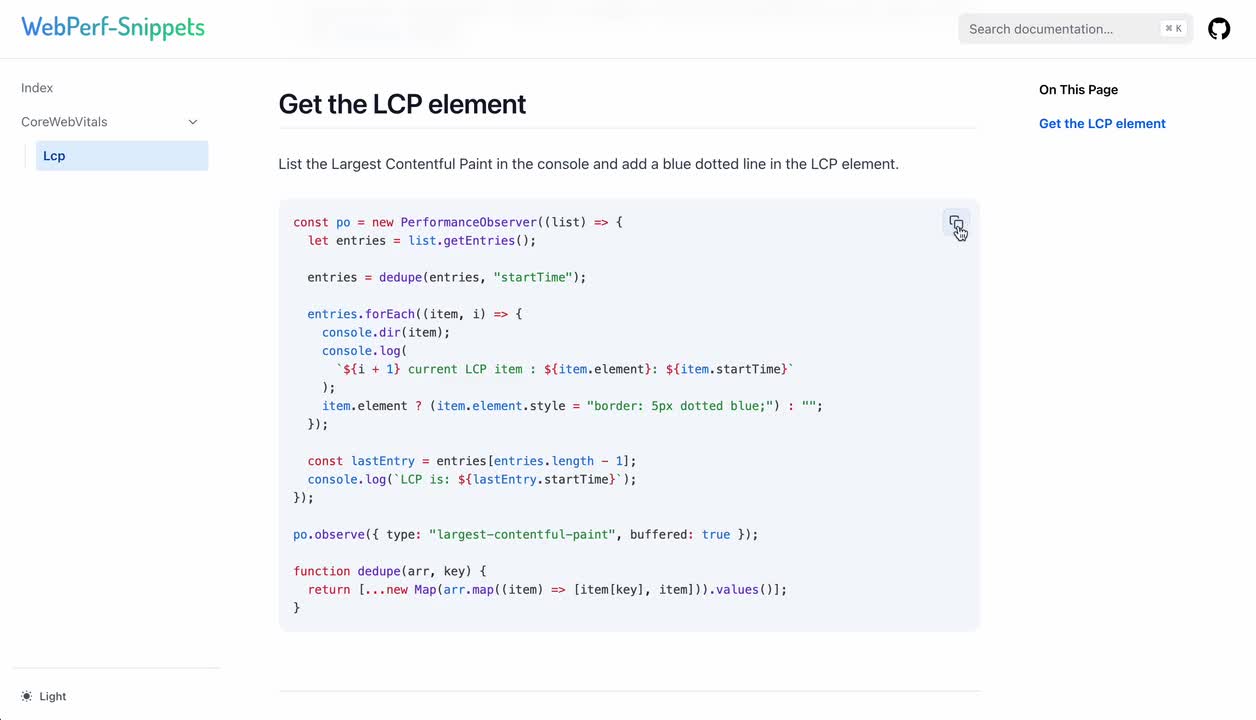
- Copy any snippet (click the copy button)
- Open DevTools (
F12orCmd+Option+I/Ctrl+Shift+I) - Go to the Console tab
- Paste and press
Enter
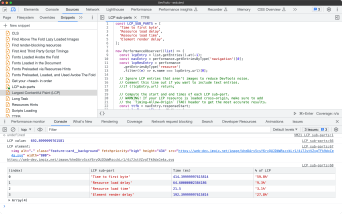
Option 2: Save as DevTools Snippet
Save frequently used snippets for quick access:
- Open DevTools → Sources tab → Snippets panel
- Click + New snippet
- Name it (e.g., "LCP")
- Paste the code
- Right-click → Run (or
Cmd+Enter/Ctrl+Enter)
Option 3: Use with AI Agent Skills
Run snippets autonomously through an AI agent via Claude Code (opens in a new tab) and Chrome DevTools MCP (opens in a new tab). The WebPerf Skills (opens in a new tab) provide deterministic, consistent measurements across sessions — the agent executes the exact snippet code without improvising JavaScript.
Available skills: webperf, webperf-core-web-vitals, webperf-loading, webperf-interaction, webperf-media, webperf-resources.
→ Learn how WebPerf Agent Skills work (opens in a new tab)
Video tutorial
AI Agent Skills
WebPerf Snippets powers a set of Agent Skills (opens in a new tab) for autonomous performance audits. Instead of copying and pasting snippets manually, an AI agent executes them deterministically through Chrome DevTools MCP — the same code, every time, across sessions and models.
| Skill | What it covers |
|---|---|
webperf | General-purpose performance audit entry point |
webperf-core-web-vitals | LCP, CLS, INP with guided diagnosis workflows |
webperf-loading | TTFB, FCP, render-blocking, fonts, scripts, resource hints |
webperf-interaction | INP, long tasks, scroll jank, animation frames |
webperf-media | Image and video audits, lazy loading, LCP media |
webperf-resources | Network quality, adaptive loading strategies |
The skills include decision trees that automatically trigger deeper analysis when thresholds are exceeded — for example, when TTFB is slow, the agent runs TTFB sub-parts diagnostics to pinpoint whether the issue is DNS, connection, or backend latency.
→ Read more about WebPerf Agent Skills (opens in a new tab)
CLI
Run the same curated snippets headlessly via Playwright — no copy-pasting into DevTools. Diagnose LCP regressions in CI, gate pull requests on real performance budgets, and automate the audits you already run by hand.
npx webperf-snippets https://web.dev --workflow audit
npx webperf-snippets https://web.dev --budget-lcp 2500 --budget-cls 0.1| Workflow | What it runs |
|---|---|
core-web-vitals | LCP, CLS — with automatic LCP-Subparts follow-up |
audit | Render-blocking, resource hints, critical CSS, TTFB, scripts, images |
Resources
- Web Vitals (opens in a new tab) - Learn about Core Web Vitals
- Chrome DevTools (opens in a new tab) - Official documentation
- GitHub Repository (opens in a new tab) - Star, fork, or contribute