WebPerf Snippets
A curated collection of JavaScript snippets to measure and debug Web Performance directly in your browser's DevTools console.
What you can measure
| Category | What it includes |
|---|---|
| Core Web Vitals | LCP, CLS, INP - the metrics that impact SEO and user experience |
| Loading | TTFB, resource hints, scripts, fonts, images, render-blocking resources |
| Interaction | Long Animation Frames, event timing, responsiveness |
Quick Start
Copy this snippet and paste it in your browser console to see your page's Core Web Vitals:
// Quick Core Web Vitals Check
new PerformanceObserver((l) => {
  l.getEntries().forEach((e) => {
    const name = e.name || e.entryType;
    console.log(`${name}: ${Math.round(e.startTime || e.value || e.duration)}ms`);
  });
}).observe({ type: "largest-contentful-paint", buffered: true });

new PerformanceObserver((l) => {
  let cls = 0;
  l.getEntries().forEach((e) => { if (!e.hadRecentInput) cls += e.value; });
  console.log(`CLS: ${cls.toFixed(3)}`);
}).observe({ type: "layout-shift", buffered: true });
For more detailed analysis, explore the snippets in each category.
How to use
Requirements
All snippets are tested in Google Chrome (opens in a new tab). Most snippets also work in other Chromium-based browsers (Edge, Brave, Arc) and Firefox. Safari has limited Performance API support.
Option 1: Run in browser console
- Copy any snippet (click the copy button)
- Open DevTools (
F12orCmd+Option+I/Ctrl+Shift+I) - Go to the Console tab
- Paste and press
Enter
Option 2: Save as DevTools Snippet
Save frequently used snippets for quick access:
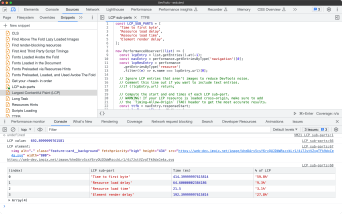
- Open DevTools → Sources tab → Snippets panel
- Click + New snippet
- Name it (e.g., "LCP")
- Paste the code
- Right-click → Run (or
Cmd+Enter/Ctrl+Enter)
Video tutorial
Resources
- Web Vitals (opens in a new tab) - Learn about Core Web Vitals
- Chrome DevTools (opens in a new tab) - Official documentation
- GitHub Repository (opens in a new tab) - Star, fork, or contribute